
Dashboard overview
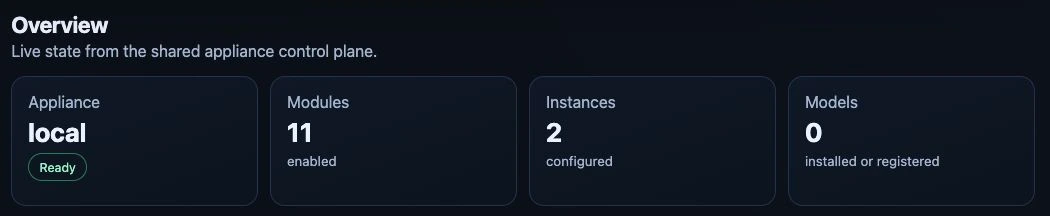
Overview on the test appliance, captured 24 September 2026. The URL list below the cards is outside this crop. Select any screenshot to open it at full size.
Signing in
On the local Keycloak login page, select Remember me only on a trusted, personal browser. Without it, the session ends after 30 minutes without use or 10 hours overall. With it, the limits are 7 days without use and 30 days overall, including a closed browser or standby. Active use renews the idle limit, not the overall maximum. Sign out explicitly to end the session.
Access tokens still last five minutes and renew automatically. After this feature is installed, sign out and sign in once with the checkbox; an existing browser may still carry the earlier, shorter cookie expiry. Administrator-customized policies and an external identity provider can impose different limits.
Dashboard and application token cookies are limited to each exact hostname. Opening another service reuses the central sign-in without sending the first service's token cookies to it. Signing out ends that shared identity session; old cookies on another service do not grant continued access. After upgrading, sign in again. Legacy Magic Stick token cookies are migrated narrowly, not by erasing all application data. If an older browser still reports Request Header Or Cookie Too Large, clear that appliance site's old cookies once and sign in again; do not disable certificate validation or authentication.
After signing out, opening a protected application's page starts sign-in again on the central login page and returns to that application's home page. Only its own expired token cookies are cleared. A real Access denied response means your account lacks permission; repeatedly signing in does not grant it. If identity verification is unavailable, retry later instead of clearing all site data. API requests and unsaved writes are never automatically replayed.
UI Areas
| Area | Purpose |
|---|---|
| Overview | Shows appliance health, module/instance/model counts, and the complete local, public, or direct URLs discovered for modules and app instances from Ingress, Gateway API HTTPRoute, and instance status. |
| Models | Creates and edits Ollama, vLLM and experimental Omni models in one local configuration form with shared CPU controls and engine-specific hardware and memory options. Starts, stops and removes local and external models; discovers Hugging Face repositories and Ollama Library models with selectable artifacts/tags; retains tested presets and direct references; shows per-device memory gauges and bounded runtime logs. |
| Services | Combines modules and instances: application cards contain their instances, shared AI runtime services stay compact, and technical platform modules are collapsed by default. The create dialog first selects an application and then shows only its configuration. |
| API Access | Lets administrators create multiple named LiteLLM API keys, view their non-secret metadata, and revoke individual keys. |
| Mesh | Administrator-only page directly below API Access for Private Mesh setup, membership, invitations, local-model sharing, and relay settings. Existing Settings Mesh links open this page. |
| Kubernetes Access | Lets administrators assign Viewer, Operator, or Cluster Administrator access to existing SSO identities and download or copy token-free OIDC kubeconfigs. |
| System → Settings → Federated SSO | Free Registered or Commercial: validates OIDC discovery or SAML metadata, stores providers in Keycloak, and maps exact upstream claim/attribute values to fixed Magic Stick roles. |
| System → Settings → Local console | Lets administrators choose which access the monitor and keyboard attached to the appliance have without a login: Administrator (default), Operator, Viewer, or Off. See automatic sign-in. |
| System | Groups Settings, License, Users, Hardware, System Status, and Computer power behind one primary navigation item. Settings contains the Domains, Federated SSO, Network, Updates, and Local console subtabs. System Status contains Overview, GPU Operators, Flux, Network & routes, Model cache, and Regression tests. Administration areas retain their role, identity, and entitlement restrictions; Hardware and the read-only status tabs remain available to every dashboard role. Model cache and Regression tests are administrator-only; Computer power remains an administrator-only System tab immediately after System Status. |
Mesh has a direct link at #/mesh. Settings subtabs have direct links at #/system/settings/<section>; Domains
is the default at #/system/settings. Former #/system/network and
#/system/updates links redirect to the corresponding Settings subtab. Former
#/settings/mesh, #/system/mesh, and #/system/settings/mesh links redirect to Mesh.
Only the selected subtab mounts its page; opening Settings does not apply
network, update, domain, or identity configuration changes.
For software versions, use System → Settings → Updates → Magic Stick software. Choose Released version, optionally show prereleases, then Check channel and review the resolved revision/notes/license dates before Apply channel. Refreshing the list never updates the computer. Unverified legacy versions and offline catalogs cannot silently select main. Existing branch selections remain unchanged until explicitly applied. See updates and rollback.
System Status
Open System → System Status for a second tab bar, like the one in Settings:
- Overview shows resource counts and compact GPU-operator, Flux and route summaries.
- GPU Operators shows each provider's driver mode, version, readiness and message.
- Flux shows reconciliation state, reasons and messages.
- Network & routes shows discovered Gateway routes, hostnames and acceptance.
- Model cache and Regression tests provide administrator-only maintenance tools.
Overview is the default at #/system/status; other tabs use
#/system/status/<section>. Existing #/system/model-cache and
#/system/regression bookmarks redirect to their matching status tab. Opening or
switching tabs does not clear caches, start tests or change system configuration.
Only the selected tool loads its data; status errors do not block access to the
cache or regression page. Use arrow keys, Home and End within the status tab bar.
Regression tests
On a dedicated disposable test server, open System → System Status → Regression tests as an
administrator. No license is required, including report downloads.
Enable the optional runner and register the Appliance once, then choose
Start regression tests. Choose Non-destructive only (default) or
Include destructive tests. Non-destructive runs leave existing workloads,
settings, licenses and caches unchanged; they create a temporary viewer account,
runner Job and reports, run isolated checks and read the selected phase's live
inventory. Model lifecycle, inference, sharing, recovery and other mutating live
checks are not run. Excluded steps are listed separately, not passed or blocked.
Product-service/application live workflows (including Hermes, app access checks
and service credentials) are currently excluded from standard runs and marked
deferred to separate regression. Isolated checks and core user, license,
Kubernetes, model and GPU tests remain active. This does not disable product
services or claim full service/application acceptance. Existing failed reports
and the cleanup of old test resources are unchanged.
An explicit Separate services: installation, SSO/public access and removal
(including Pi Coding Agent) selection runs those services separately on a
disposable server. It checks lifecycle first, access with SSO and supported public
access second, and verifies removal. Model functions remain deferred. Hermes
remains separate. This selection requires matching updated
images and does not change the scope of ordinary complete runs.
Without-SSO coverage uses only the normal Public without login option on
owned application instances, not a bypass of protected standalone services.
For a focused repeat, Test selection offers fixed external-provider, GPU
verification, two-card independent-copy Ollama, two-/four-card shared Ollama split
and sharing scenarios. Choosing one selects its advertised phase
and destructive mode; automatic preparation and cleanup still apply. A passing
diagnostic is not full-phase acceptance.
All phases are selected by default. To run only GPU
tests, choose Clear selection, check Phase 3, then Start tests. You
can also select several phases. The saved selection appears beside progress
and limits the report to those phases.
For focused Phase 4 diagnosis, use Test selection to choose slot races
(SLOT-09), sharing reload (SHR-12), exact restoration (HAR-08), or the
combined remaining-case profile (also SLOT-03 and SHR-07). This selects
Include destructive tests and only Phase 4, with normal preparation and
cleanup. The report is explicitly a diagnostic subset, not full-phase acceptance.
Choose All tests in selected phases to return to phase selection. These
profiles appear only after a supporting runner has been published and installed.
The suite runs in Kubernetes and survives leaving or reloading the page.
It can stop models and change test-server state; never
register a production Appliance.
This test-server registration is not license activation. License/SSO cases use
test fixtures; missing prerequisites block those checks, not the whole suite.
Runner activation shows an activity bar while sending the request and waiting
for readiness. Image downloads and service startup can take several minutes;
registration becomes available only once the runner is ready. Activation alone
does not start tests.
Every full start cleans up the previous run, checks the baseline, then creates a
fresh test ID and executes the selected tests from the beginning. Earlier results
are never reused. For diagnosis, Clean up previous test run performs only
the recorded cleanup, including retained setup access after a lock was released.
Its adjacent status explains whether cleanup is needed, already complete or
blocked by active work or unverifiable ownership.
An active run or unavailable journal disables the button and explains why.
External runs must be recovered from their original runner's private journal.
If cleanup reports PROCESS_STATE, the runner could not confirm that its
workers ended. After the old Kubernetes run has stopped, use the same cleanup
button: it checks the exact execution before cleaning resources. Missing or
changed ownership evidence still requires inspection; do not remove the lock
manually. Original failed reports remain failed after successful cleanup.
Non-destructive runs never perform that cleanup automatically: clean up a
previous interrupted run separately first. A successful limited report does not
certify complete phases or real model inference. The saved mode survives reload.
The page shows current phase/check and progress. 100% means execution finished,
not passed. The main All checks tiles count case/variant/layer evidence
from isolated and live checks together, including runner and cleanup errors.
Expand Executable scenarios for the separate scenario counts; one scenario
can produce several check results, and an error without a scenario ID still
counts in All checks. Live evidence and the phase table retain their own labels.
Totals come from the saved report, not from adding phases or the visible failure
list. Without final totals, the page says they are unavailable and labels any
recorded scenario progress as preliminary; missing results never mean zero failures.
HTML and text reports also show All checks before executable scenarios.
The page also separates Tests, Resource cleanup, and
Test account: a finished Job or removed account does not prove resources were
cleaned. Cleanup is unknown, required, running, verified, or blocked, with
its recorded reason/stage. Missing fields in old reports mean not verified, not
clean; retain the exact private journal for recovery. Expand Failures and blocked checks for the reason,
phase, variant, check layer, stage, next action and available filtered trace
location. When recorded, GPU verification observations separately shows
the attempted engine/scope, HTTP status, fixed rejection reason and configuration
generations. Missing values mean unknown. The runner may wait briefly for an
unchanged configuration to settle, but never repeats a rejected verification
request automatically. These observations are not a successful GPU test or a
cleanup proof. Blocked by prerequisite means required hardware, access or fixtures
are unavailable. Blocked by failure means an earlier test, preparation or
cleanup failed; its recorded blocking check and trace are shown. Cancelled and
unrecorded causes in older reports remain separate. Missing execution evidence in
a new report is an explicit harness failure. Download report saves the full sanitized archive; HTML summary
and JUnit XML are also available. Cancel requests bounded teardown, not a
claim of successful restoration. See the short runner guide.
For a failed automatic preparation, the result shows its reason, setup stage
and suggested next action. Separate fixture and live counts make it clear
whether any checks actually ran against this Appliance.